My Little World

神经网络的相关推导公式

矩阵维度

为方便重复计算,减少for循环的使用,在神经网络的计算过程中,尽可能的将数据转成向量进行计算
利用向量的广播能力进行快速计算,神经网络多层传递过程中,矩阵的维度一般遵循以下关系

如果前一层(输入)维度为(m,1),中间层维度是(n, 1), 后一层(输出)维度是(p, 1)
那么 中间层w的维度就是(n, m), b 的维度就是(n,1), b 的维度始终和中间层一致
输出层W的维度(p,n),b 的维度就是(p,1)

参数的矩阵维度关系

向前传播计算过程

一个神经元的计算

每个神经元的计算包括两部分,先计算z,在用激活函数计算a,
同一层不同神经元计算的区别就在于使用不同的参数

如果将参数w和b整理成向量,对当前样本数据进行一次性向量计算
就可以直接得到当前层的直接产出向量

一层神经元的计算

同样,每一层都可以用相同的计算式表示

一组样本数据的计算

通过for 循环进行每一层的计算可得到所有样本数据的预测数据y^

但是通过将输入层维度(m,1) 的向量增加为(m,x)的向量,可以实现一次计算x个样本的效果,从而去掉for循环
如果中间层有n个神经元,输出得到的结果就是(n,x)的矩阵
第n - 1行 上的x个数,每个数代表每个样本数据在中间层第n-1个神经元的计算后的值
第x - 1列 上的n个数,每个数代表第x-i个样本数据在中间层计算后的每个神经元的值

最终经过两层神经元处理后变成,结果变成(1,x)的向量,每个值代表每个样本经过神经网络计算后的预测值

输入输出值矩阵维度之间的关系

小结

其他激活函数

除了sigmoid 激活函数外,常见的激活函数还有Tanh, ReLu,和leaky ReLu,
后三者更常见,且使用更广泛,sigmoid基本只用于二分类场景

为什么不使用线性函数作为激活函数

因为如果使用线性函数作为激活函数,无论神经网络有多少层,都相当于只进行了一次线性函数计算,隐藏层作用消失

不同激活函数的导数


向后传播过程

回顾一下梯度下降的计算过程

对于单个神经元的向后传播过程,就是计算单个神经元参数偏导数的过程

对于多层的神经网络进行带入

小结

同向前传播一样,通过引入向量矩阵,减少for循环

为啥不能初始化参数为0?

如果初始化参数为0或相同值,那么所有节点计算的值都相同,会产生对称性,对后续计算的影响也相同,同样会导致隐藏层节点结算无效
解决办法就是随机初始化参数

一般一开始会将参数随机成比较小的值,如果一开始是比较大的值,z 的值就会比较大,
当激活函数是sigmoid 或者tanh 这样的激活函数时,
计算结果所在的位置就会在梯度比较平缓的地方导致,激活函数处于比较饱和的状态,梯度下降比较慢,影响学习速度

深度网络

向前传播

向后传播

一些超参数

小结

为什么要使用深层网络

使用小的(单层神经元数据量少的)的但是有多层的深层网络,往往会比使用浅层(layer数少)网络计算步骤更简洁
比如下面的电路与或非门计算过程
如果像左侧使用深层网络,每一次层神经元都少一半
如果使用右侧单层神经网络,这一层上的神经元会以2的指数方式计算
总体算下来,深层网络需要处理的神经元会少很多

实验练习

逻辑回归全过程

gitbub[ipynb]链接
实验

思路梳理

数据处理

向量化

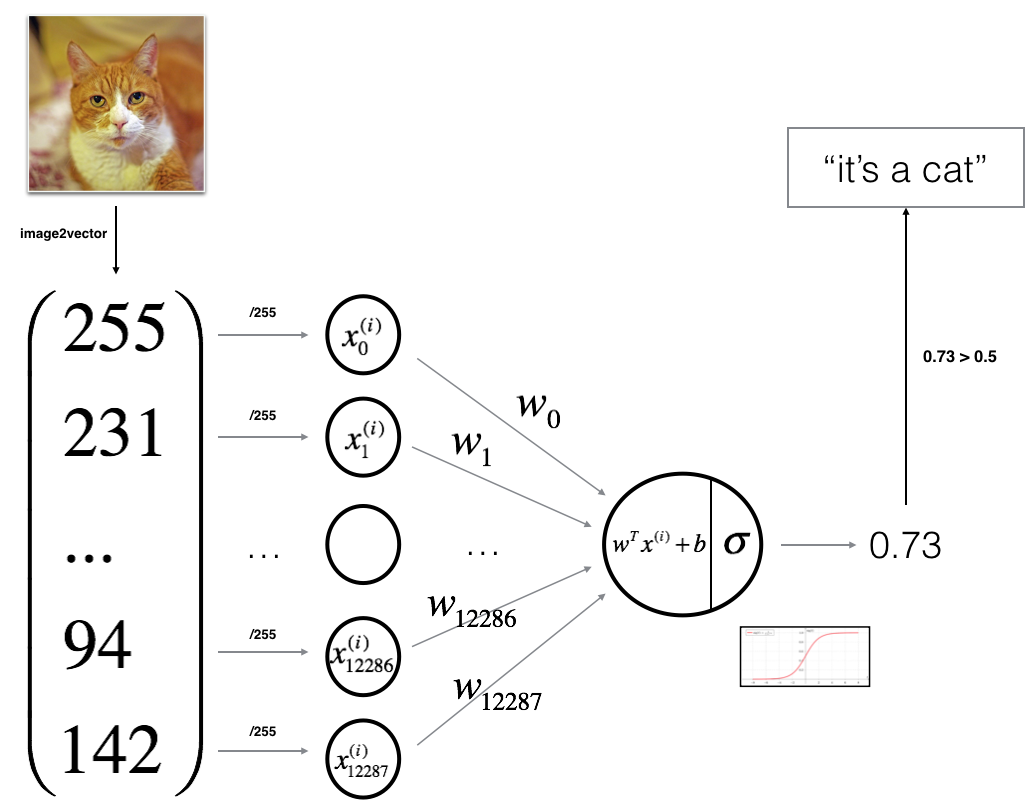
实验中要实现对一张图片是否是猫的判断,
首先要对图片进行处理,将图片转换成向量,
一个像素点由RGB三个数据组成, 现在如果横竖都取图片的64个像素点
一张6464的图片就有6464=4096个 [r,g,b] 这样的数据,
一张图片的数据表示就是

1
2
3
4
5
6
7
[
[[196 192 190], [193 186 182],...中间还有61组, [188 179 174]], 每一行 有64个
[[196 192 190], [193 186 182],..., [188 179 174]],
... 中间有60行
[[196 192 190], [193 186 182],..., [188 179 174]]
[[196 192 190], [193 186 182],..., [88 79 74]]
] 一共64行

现在把所有数据摊平再转置,就可转成一个[64643=12288, 1]的向量,
也就是m个测试数据组成的矩阵中的一列

1
[[196,], [192,],..., [88,], [79,],[74,]]

A trick when you want to flatten a matrix X of shape (a,b,c,d) to a matrix X_flatten of shape (b ∗ c ∗ d, a) is to use:

1
X_flatten = X.reshape(X.shape[0], -1).T

现在我们有209个训练数据的训练集train_set_x_orig的维度是(209, 64, 64, 3)
a 就是209
现将要将训练集数据一次性转成209列的向量

1
2
m_train = train_set_x_orig.shape[0] // 209
train_set_x_flatten = train_set_x_orig.reshape(m_train, -1).T

train_set_x_flatten 现在的维度就是(12288, 209)
每一列是一张图片的像素数据

数据中心标准化

基于现在处理的是图片的像素数据,所以所有的数据肯定都在0~255之间

One common preprocessing step in machine learning is to center and standardize your dataset,
meaning that you substract the mean of the whole numpy array from each example,
and then divide each example by the standard deviation of the whole numpy array.
But for picture datasets,
it is simpler and more convenient and works almost as well to just divide every row of the dataset by 255 (the maximum value of a pixel channel).

一个常见的预处理步骤是尽可能将数据聚拢到坐标系0附近,常用的方法是对数据进行标准化,
也就是将数据减去均值,然后将数据除以标准差
但是对于图片数据集来说,
除以255(像素通道的最大值),会更简单,而且效果也差不多

1
train_set_x = train_set_x_flatten / 255.

小结

What you need to remember:
Common steps for pre-processing a new dataset are:
Figure out the dimensions and shapes of the problem (m_train, m_test, num_px, …)
Reshape the datasets such that each example is now a vector of size (num_px num_px 3, 1)
“Standardize” the data

常见的数据预处理步骤:

  1. 确定问题的维度和形状(m_train, m_test, num_px, …)
  2. 将数据集重新组织成每个示例都是大小为(num_px num_px 3, 1)的向量
  3. 标准化数据

构建模型

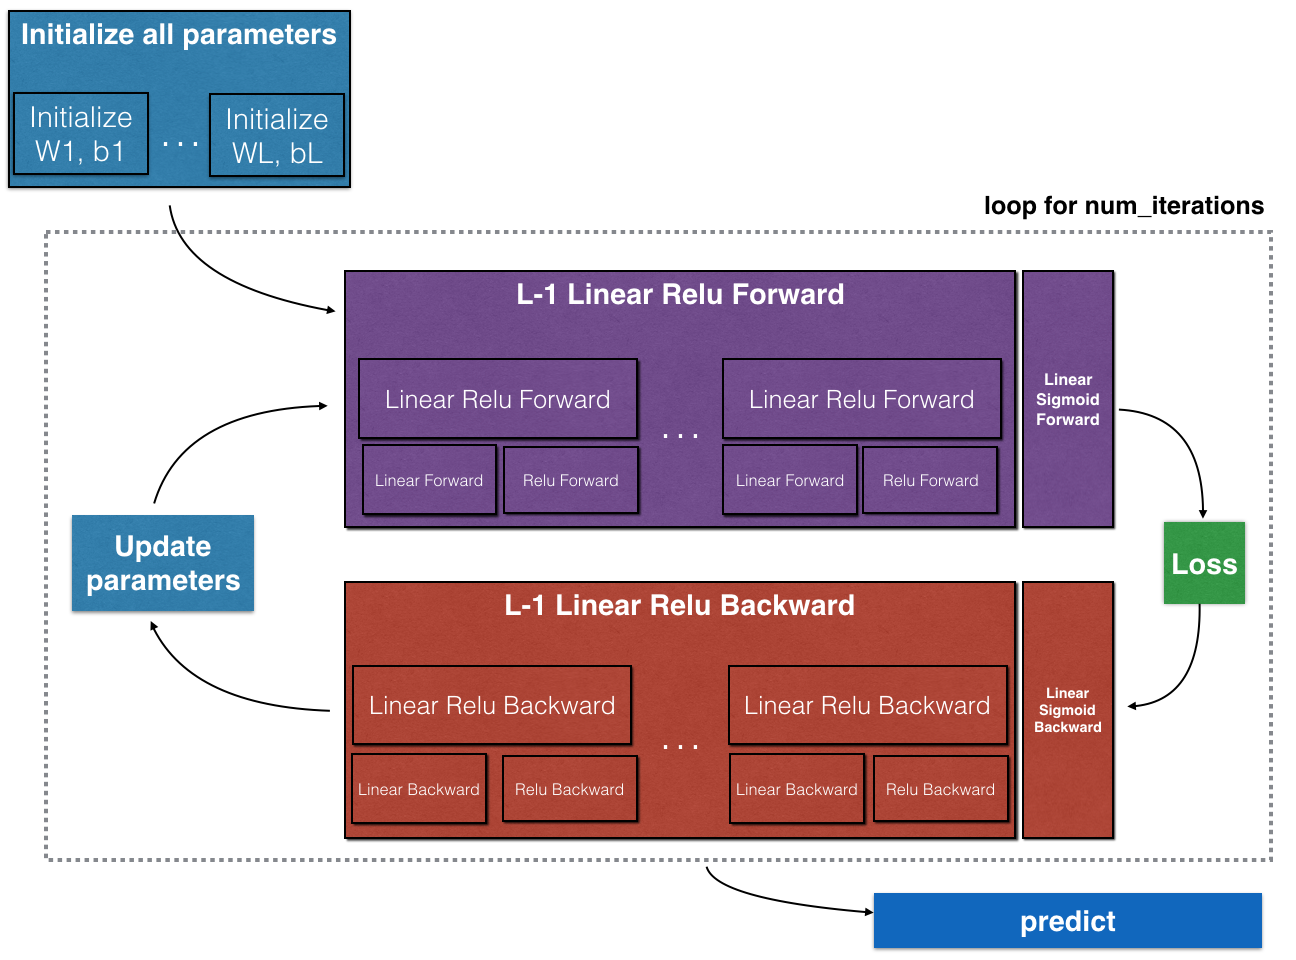
The main steps for building a Neural Network are:

Define the model structure (such as number of input features)
Initialize the model’s parameters
Loop:
Calculate current loss (forward propagation)
Calculate current gradient (backward propagation)
Update parameters (gradient descent)
You often build 1-3 separately and integrate them into one function we call model().

构建一个神经网络模型的主要步骤:

  1. 定义模型结构(例如输入特征的数量,这里是一张图片的12288个rgb数据)
  2. 初始化模型的参数
  3. 循环:
    计算当前损失(前向传播)
    计算当前梯度(反向传播)
    更新参数(梯度下降)
    通常会将1-3分别构建, 然后将它们集成到一个函数中,我们称之为model()。
𝑠𝑖𝑔𝑚𝑜𝑖𝑑函数实现

𝑠𝑖𝑔𝑚𝑜𝑖𝑑(𝑤𝑇𝑥+𝑏)=1/(1+𝑒−(𝑤𝑇𝑥+𝑏))

1
2
3
4
5
6
7
8
9
10
"""
Compute the sigmoid of z
Arguments:
z -- A scalar or numpy array of any size.
Return:
s -- sigmoid(z)
"""
def sigmoid(z):
s = 1/(1+np.exp(-z))
return s

初始化模型的参数

用0来初始化参数

1
2
3
4
5
6
7
8
9
10
11
12
13
14
15
16
17
18
19
20
21
"""
This function creates a vector of zeros of shape (dim, 1) for w and initializes b to 0.
Argument:
dim -- num_px * num_px * 3
Returns:
w -- initialized vector of shape (dim, 1)
b -- initialized scalar (corresponds to the bias)
"""
def initialize_with_zeros(dim):
w = np.zeros((dim, 1))
b = 0
return w, b

## 测试
dim = 2
w, b = initialize_with_zeros(dim)

==>
w = [[0.]
[0.]]
b = 0.0

前向向后传播实现

根据公式进行代码实现

最终得到每轮训练的损失函数和梯度

1
2
3
4
5
6
7
8
9
10
11
12
13
14
15
16
17
18
19
20
21
22
23
24
25
26
27
28
29
30
31
32
33
34
35
36
37
38
39
40
# GRADED FUNCTION: propagate

"""
Implement the cost function and its gradient for the propagation explained above

Arguments:
w -- weights, a numpy array of size (num_px * num_px * 3, 1)
b -- bias, a scalar
X -- data of size (num_px * num_px * 3, number of examples)
Y -- true "label" vector (containing 0 if non-cat, 1 if cat) of size (1, number of examples)

Return:
cost -- negative log-likelihood cost for logistic regression
dw -- gradient of the loss with respect to w, thus same shape as w
db -- gradient of the loss with respect to b, thus same shape as b

"""

def propagate(w, b, X, Y):


m = X.shape[1]

# FORWARD PROPAGATION (FROM X TO COST)
A = sigmoid(w.T @ X + b) # compute activation 得到 (m,1) 的矩阵A,m 是训练集样本数
cost = -np.mean(Y * np.log(A) + (1 - Y) * np.log(1 - A)) # compute cost, 在某些 NumPy 的特定版本或上下文中, np.mean 的输出可能是形状为 (1,) 的数组,而不是一个纯标量

# BACKWARD PROPAGATION (TO FIND GRAD)
dw = X @ (A - Y).T / m
db = np.mean(A - Y)

assert(dw.shape == w.shape)
assert(db.dtype == float)
cost = np.squeeze(cost) # 移除多余的单一维度,确保 cost 是标量
assert(cost.shape == ()) # 这里明确要求 cost 的形状是 (),即零维标量。如果 cost 是 (1,),那么会触发断言错误。

grads = {"dw": dw,
"db": db}

return grads, cost

梯度下降实现

1
2
3
4
5
6
7
8
9
10
11
12
13
14
15
16
17
18
19
20
21
22
23
24
25
26
27
28
29
30
31
32
33
34
35
36
37
38
39
40
41
42
43
44
45
46
47
48
49
50
51
52
53
54
55
56
"""
This function optimizes w and b by running a gradient descent algorithm

Arguments:
w -- weights, a numpy array of size (num_px * num_px * 3, 1)
b -- bias, a scalar
X -- data of shape (num_px * num_px * 3, number of examples)
Y -- true "label" vector (containing 0 if non-cat, 1 if cat), of shape (1, number of examples)
num_iterations -- number of iterations of the optimization loop
learning_rate -- learning rate of the gradient descent update rule
print_cost -- True to print the loss every 100 steps

Returns:
params -- dictionary containing the weights w and bias b
grads -- dictionary containing the gradients of the weights and bias with respect to the cost function
costs -- list of all the costs computed during the optimization, this will be used to plot the learning curve.

1) Calculate the cost and the gradient for the current parameters. Use propagate().
2) Update the parameters using gradient descent rule for w and b.
"""

def optimize(w, b, X, Y, num_iterations, learning_rate, print_cost = False):
costs = [] // 收集每轮计算的损失函数值

for i in range(num_iterations):

# Cost and gradient calculation (≈ 1-4 lines of code)
# 第一轮用初始化w和b计算的损失函数和梯度
# 后面用更新后的w和b计算的损失函数和梯度
grads, cost = propagate(w, b, X, Y)

# 解构梯度
dw = grads["dw"]
db = grads["db"]

# 梯度下降更新参数
w = w - learning_rate * dw
b = b - learning_rate * db

# Record the costs
# 每100轮记录一次损失函数值
if i % 100 == 0:
costs.append(cost)

# 如果需要每100轮打印下损失函数就再打印下
if print_cost and i % 100 == 0:
print ("Cost after iteration %i: %f" %(i, cost))

# num_iterations轮 训练结束后返回最终更新到的参数,梯度,和损失函数集合(可以用于绘制学习曲线)
params = {"w": w,
"b": b}

grads = {"dw": dw,
"db": db}

return params, grads, costs

预测函数

根据公式实现预测函数

𝑌̂ =𝐴=𝜎(𝑤𝑇𝑋+𝑏)

1
2
3
4
5
6
7
8
9
10
11
12
13
14
15
16
17
18
19
20
21
22
23
24
25
26
27
28
29
'''
Predict whether the label is 0 or 1 using learned logistic regression parameters (w, b)

Arguments:
w -- weights, a numpy array of size (num_px * num_px * 3, 1)
b -- bias, a scalar
X -- data of size (num_px * num_px * 3, number of examples)

Returns:
Y_prediction -- a numpy array (vector) containing all predictions (0/1) for the examples in X
'''
# X 是摊平后数据 (12288, m), X.shape[0] 是影响因素个数 12288 个RGB值, X.shape[1] 是训练集样本数
def predict(w, b, X):

m = X.shape[1]
Y_prediction = np.zeros((1,m))
w = w.reshape(X.shape[0], 1)

# Compute vector "A" predicting the probabilities of a cat being present in the picture
A = sigmoid(w.T @ X + b)

for i in range(A.shape[1]):
# Convert probabilities A[0,i] to actual predictions p[0,i]
# 大于0.5 预测为1 是猫, 小于0.5 预测为0, 不是猫
Y_prediction[0, i] = A[0, i] > 0.5

assert(Y_prediction.shape == (1, m))

return Y_prediction

组装模型

1
2
3
4
5
6
7
8
9
10
11
12
13
14
15
16
17
18
19
20
21
22
23
24
25
26
27
28
29
30
31
32
33
34
35
36
37
38
39
40
41
42
43
44
45
46
47
48
49
50
51
52
53
54
55

"""
Builds the logistic regression model by calling the function you've implemented previously

Arguments:
X_train -- training set represented by a numpy array of shape (num_px * num_px * 3, m_train)
Y_train -- training labels represented by a numpy array (vector) of shape (1, m_train)
X_test -- test set represented by a numpy array of shape (num_px * num_px * 3, m_test)
Y_test -- test labels represented by a numpy array (vector) of shape (1, m_test)
num_iterations -- hyperparameter representing the number of iterations to optimize the parameters
learning_rate -- hyperparameter representing the learning rate used in the update rule of optimize()
print_cost -- Set to true to print the cost every 100 iterations

Returns:
d -- dictionary containing information about the model.
"""

def model(X_train, Y_train, X_test, Y_test, num_iterations = 2000, learning_rate = 0.5, print_cost = False):

# initialize parameters with zeros (≈ 1 line of code)
# 初始化模型的参数
w, b = initialize_with_zeros(X_train.shape[0])

# Gradient descent (≈ 1 line of code)
# 根据训练数据采用梯度下降方法更新参数
parameters, grads, costs = optimize(w, b, X_train, Y_train, num_iterations, learning_rate, print_cost)

# Retrieve parameters w and b from dictionary "parameters"
w = parameters["w"]
b = parameters["b"]

# Predict test/train set examples (≈ 2 lines of code)
# 用训练好的参数预测测试集和训练集的结果
Y_prediction_test = predict(w, b, X_test)
Y_prediction_train = predict(w, b, X_train)

# Print train/test Errors
# 打印训练集和测试集的准确率
print("train accuracy: {} %".format(100 - np.mean(np.abs(Y_prediction_train - Y_train)) * 100))
print("test accuracy: {} %".format(100 - np.mean(np.abs(Y_prediction_test - Y_test)) * 100))

# 返回模型训练的损失函数值(学习曲线),训练测试数据集的预测结果(判断模型是否拟合),模型的参数, 学习率,迭代次数等信息
d = {"costs": costs,
"Y_prediction_test": Y_prediction_test,
"Y_prediction_train" : Y_prediction_train,
"w" : w,
"b" : b,
"learning_rate" : learning_rate,
"num_iterations": num_iterations}

return d

# 调用模型
# 注意入参train_set_x, train_set_y, test_set_x, test_set_y, 是经过预处理的数据集
d = model(train_set_x, train_set_y, test_set_x, test_set_y, num_iterations = 2000, learning_rate = 0.005, print_cost = True)

模型分析

  1. 预测结果分析

除了函数本身里面的准确率计算,可以初步判断模型是否过拟合训练数据,还可以单独拿出一个测试数据,和 预测数据进行结果比较,进行验证

1
2
3
index = 14
plt.imshow(test_set_x[:,index].reshape((num_px, num_px, 3)))
print ("y = " + str(test_set_y[0,index]) + ", you predicted that it is a \"" + classes[int(d["Y_prediction_test"][0,index])].decode("utf-8") + "\" picture.")
  1. 学习曲线分析
1
2
3
4
5
6
7
# Plot learning curve (with costs)
costs = np.squeeze(d['costs'])
plt.plot(costs)
plt.ylabel('cost')
plt.xlabel('iterations (per hundreds)')
plt.title("Learning rate =" + str(d["learning_rate"]))
plt.show()
  1. 学习率分析 or 超参数分析

增加训练次数,观察学习曲线变化同理

1
2
3
4
5
6
7
8
9
10
11
12
13
14
15
16
17
learning_rates = [0.01, 0.001, 0.0001]
models = {}
for i in learning_rates:
print ("learning rate is: " + str(i))
models[str(i)] = model(train_set_x, train_set_y, test_set_x, test_set_y, num_iterations = 1500, learning_rate = i, print_cost = False)
print ('\n' + "-------------------------------------------------------" + '\n')

for i in learning_rates:
plt.plot(np.squeeze(models[str(i)]["costs"]), label = str(models[str(i)]["learning_rate"]))

plt.ylabel('cost')
plt.xlabel('iterations (hundreds)')

legend = plt.legend(loc='upper center', shadow=True)
frame = legend.get_frame()
frame.set_facecolor('0.90')
plt.show()

应用训练结果进行预测

1
2
3
4
5
6
7
8
9
10
11
my_image = "my_image2.jpg"   # change this to the name of your image file 

fname = "images/" + my_image
image = np.array(plt.imread(fname))
image = image/255.
my_image = np.array(Image.fromarray(np.uint8(image)).resize((num_px,num_px))).reshape((1, num_px*num_px*3)).T // 摊平数据(12288, 1)
#my_image = scipy.misc.imresize(image, size=(num_px,num_px)).reshape((1, num_px*num_px*3)).T
my_predicted_image = predict(d["w"], d["b"], my_image)

plt.imshow(image)
print("y = " + str(np.squeeze(my_predicted_image)) + ", your algorithm predicts a \"" + classes[int(np.squeeze(my_predicted_image)),].decode("utf-8") + "\" picture.")

二分类问题的实践
scikit框架

使用隐藏层实现对非线性数据的分类

题目
我们现在有一堆数据分布成花朵的形状,非线性,如下,

可以看到上面的数据有的是红色,有的是蓝色,假设红色代表支持特朗普,蓝色代表支持拜登
我们希望用一个神经网络来对这些数据进行分类,
分类结果就是输入数据可以直接得到数据是红色还是蓝色的标签
解决思路就想办法对红色和蓝色的数据集中地区进行分块划分,
如果我们还是用sigmoid 函数,那么就会变成线性的,不会得到正确的区块划分

我们希望用一个非线性函数把数据进行精确度更好的划分

The general methodology to build a Neural Network is to:

  1. Define the neural network structure ( # of input units, # of hidden units, etc).
  2. Initialize the model’s parameters
  3. Loop: - Implement forward propagation - Compute loss - Implement backward propagation to get the gradients - Update parameters (gradient descent)

You often build helper functions to compute steps 1-3 and then merge them into one function we call nn_model().
Once you’ve built nn_model() and learnt the right parameters, you can make predictions on new data.

模型结构

涉及方程

向前传播

反向传播

实现

重点关注模型组装好后,如何使用,如何预测,精确度计算,超参数如何训练,迁移学习怎么做

非线性逻辑回归实现代码

L层神经网络实现

整体架构

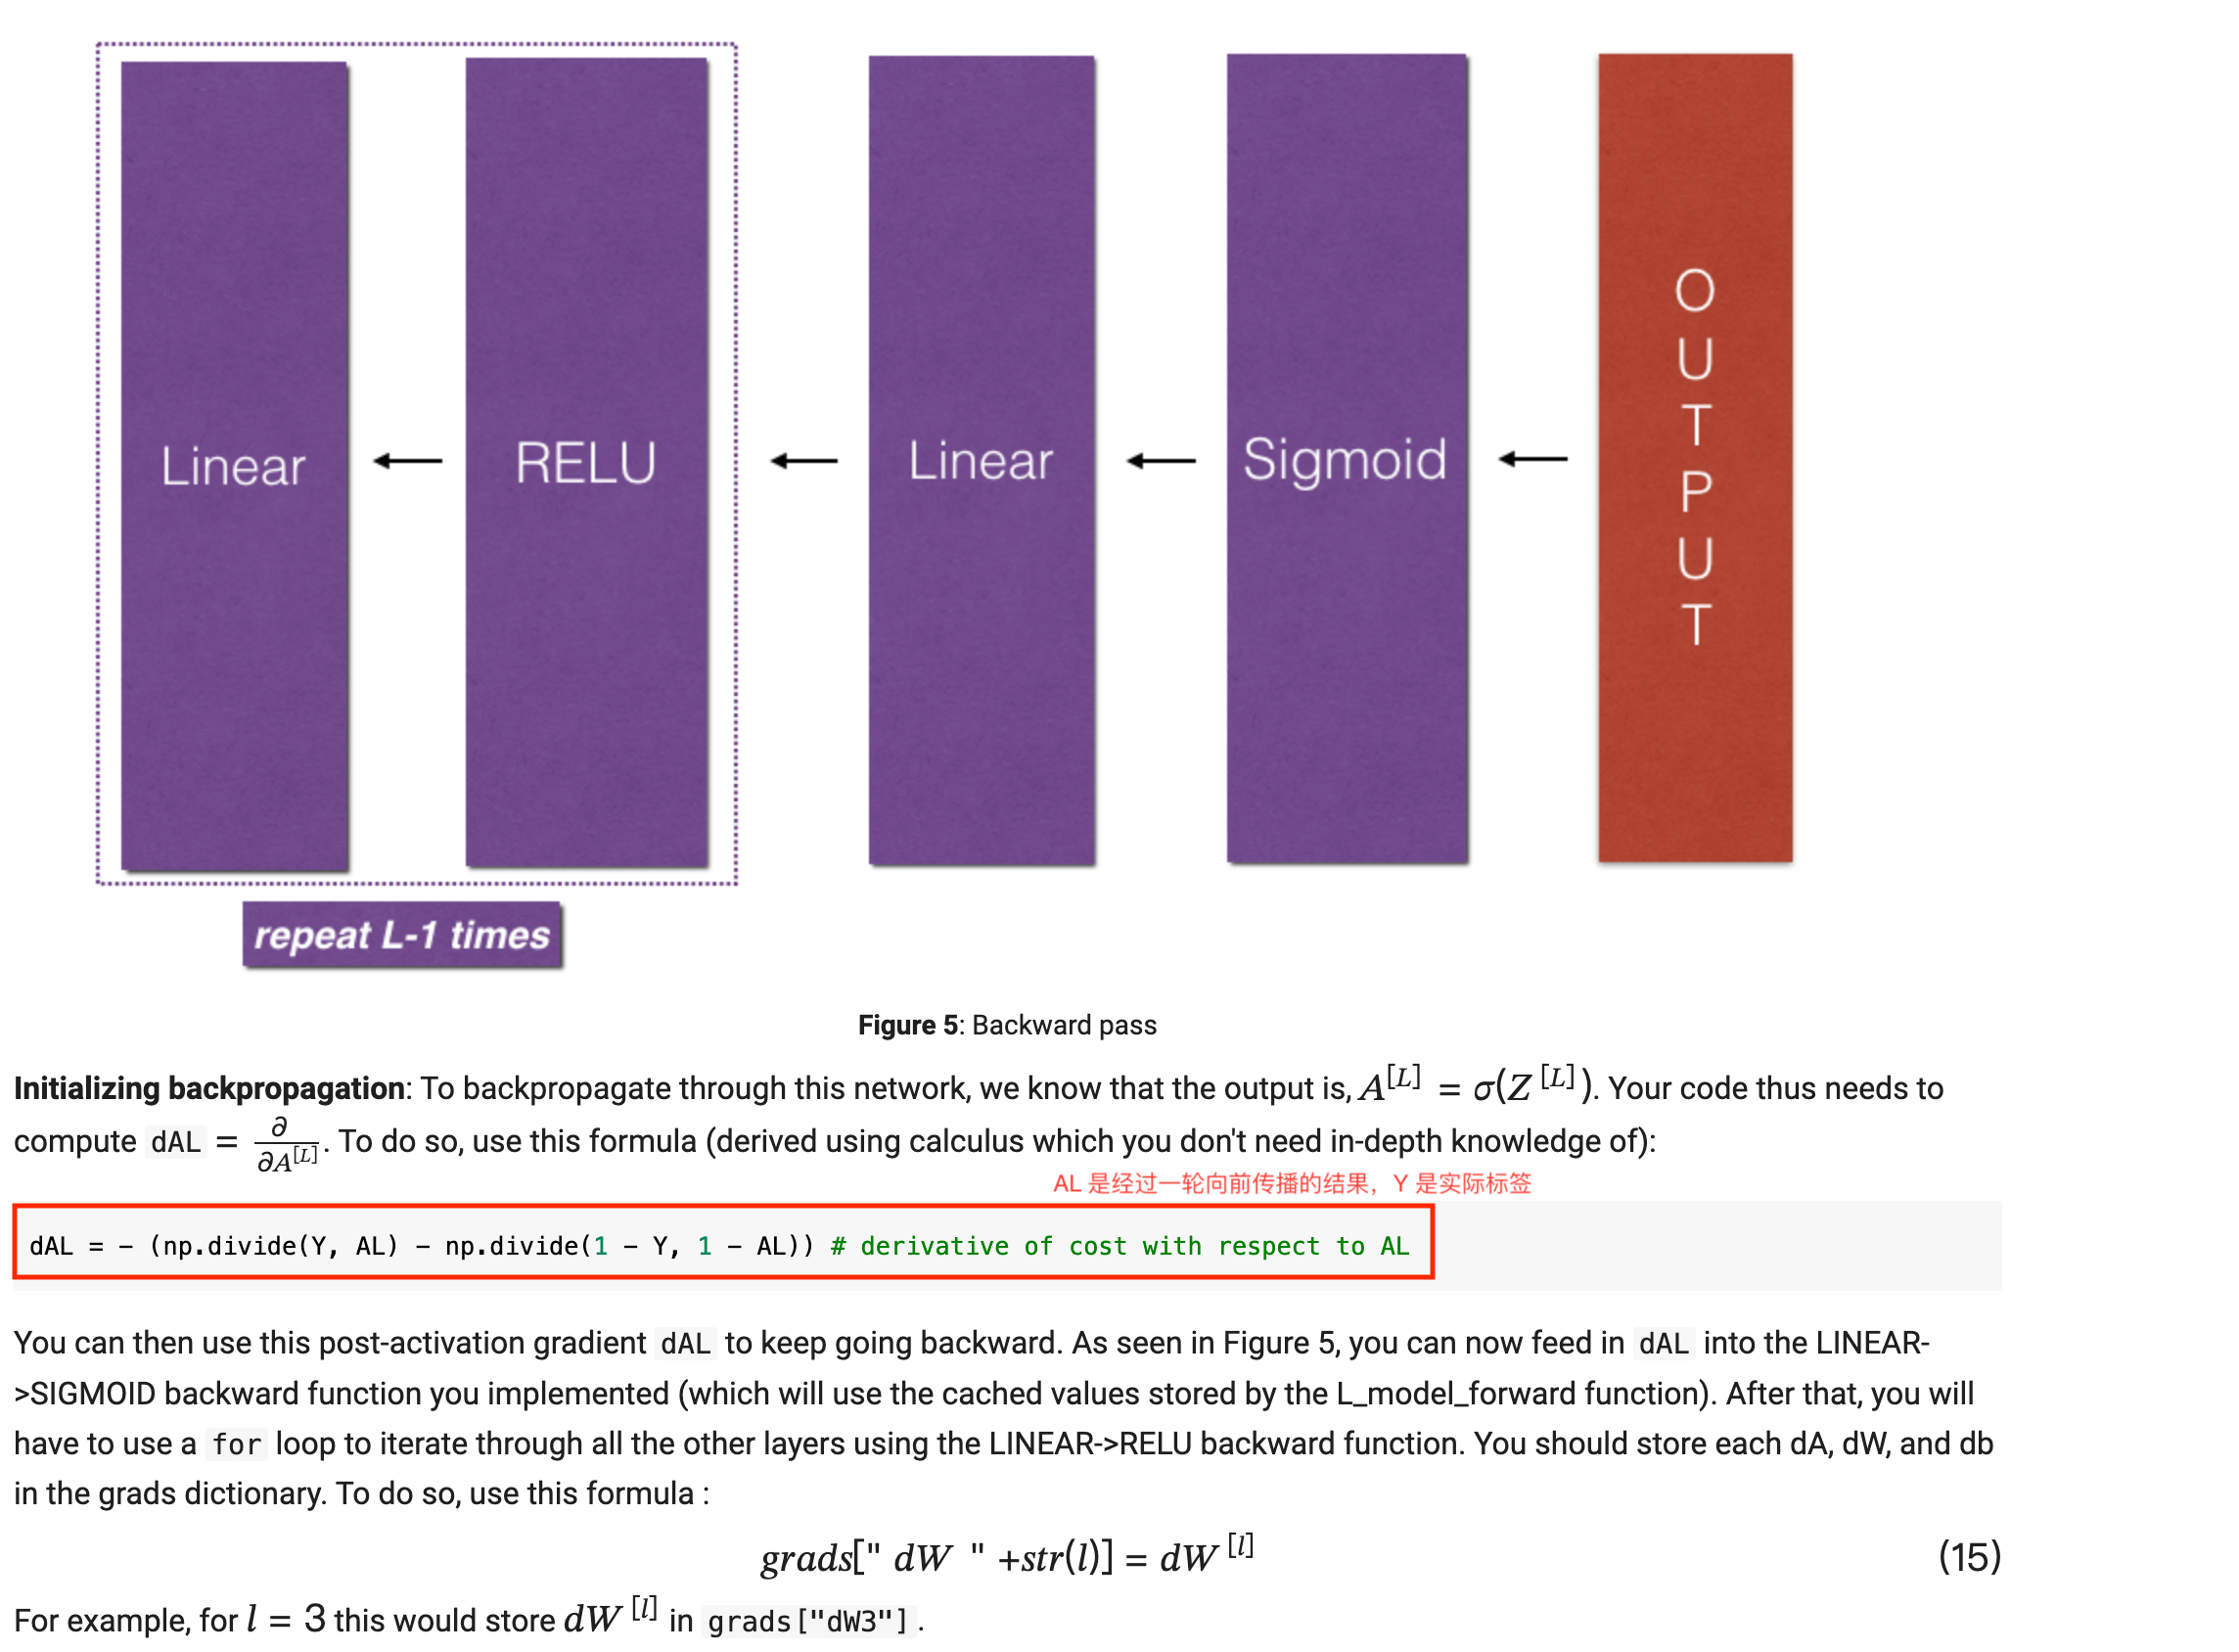
  1. 向前传播的时候,前L-1层都是先线性然后用relu 函数激活,最后一层是线性然后用sigmoid 函数激活

    The model’s structure is: LINEAR -> RELU -> LINEAR -> SIGMOID.
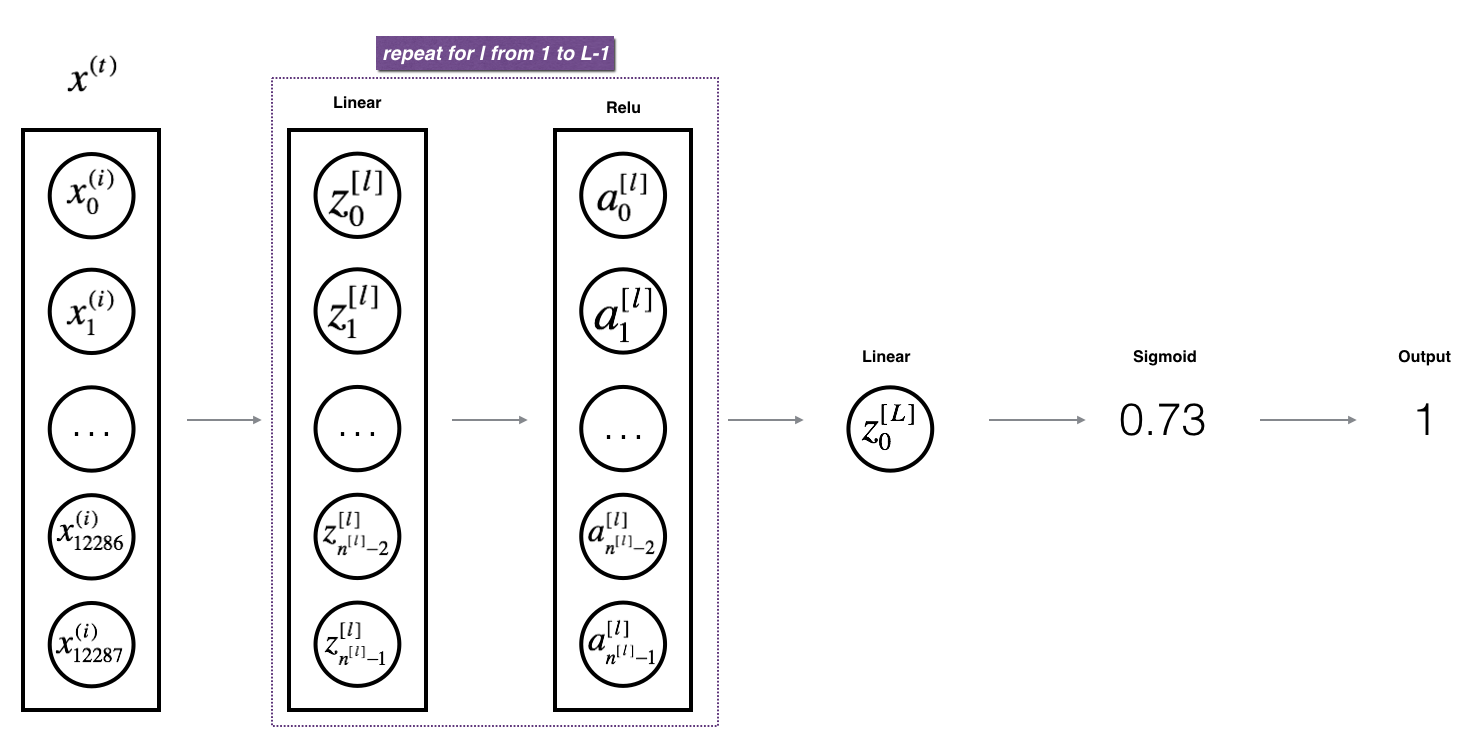
  2. 计算损失函数
  3. 反向传播的时候,与向前传播相反,除第一层是线性然后用sigmoid 函数激活,后面l-1层是线性然后用relu 函数激活,前面的每一层都是线性然后用relu 函数激活

    The model’s structure is: SIGMOID -> LINEAR -> RELU -> LINEAR -> RELU -> … -> SIGMOID.
    for every forward function, there is a corresponding backward function. That is why at every step of your forward module you will be storing some values in a cache. The cached values are useful for computing gradients. In the backpropagation module you will then use the cache to calculate the gradients. This assignment will show you exactly how to carry out each of these steps.
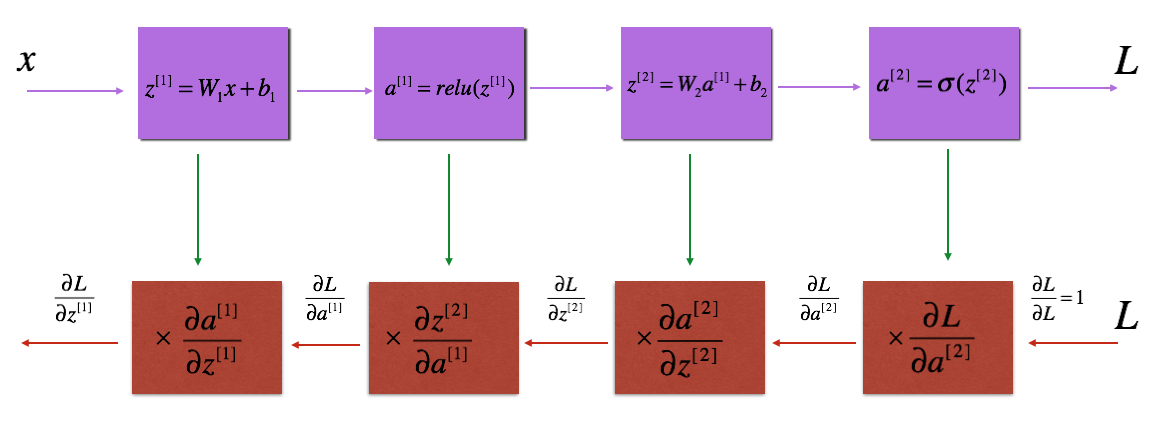
    使用链式法则, 对下面的线性函数求导dw, db, dA

    得到反向传播计算公式

注意输出层的sigmoid 函数求导
运行异常

  1. 参数初始化问题
语句 初始化方式 优缺点
np.random.randn(layer_dims[l], layer_dims[l - 1]) 标准正态分布初始化 简单,但可能导致梯度爆炸或梯度消失,尤其是在深层网络中。
np.random.randn(layer_dims[l], layer_dims[l-1]) / np.sqrt(layer_dims[l-1]) Xavier初始化的变体,np.sqrt(layer_dims[l-1])是上一层神经元个数 提供更稳定的梯度和激活值,适合对称激活函数(如Sigmoid、Tanh)。减少梯度爆炸或梯度消失问题。

如果使用 ReLU 或 Leaky ReLU 作为激活函数,可以采用 He 初始化:

1
parameters['W' + str(l)] = np.random.randn(layer_dims[l], layer_dims[l-1]) * np.sqrt(2 / layer_dims[l-1])